
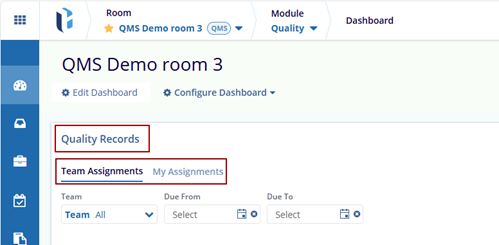
Quality Records
The Quality Records dashlet consists of two sections:
- Team Assignments
- My Assignments
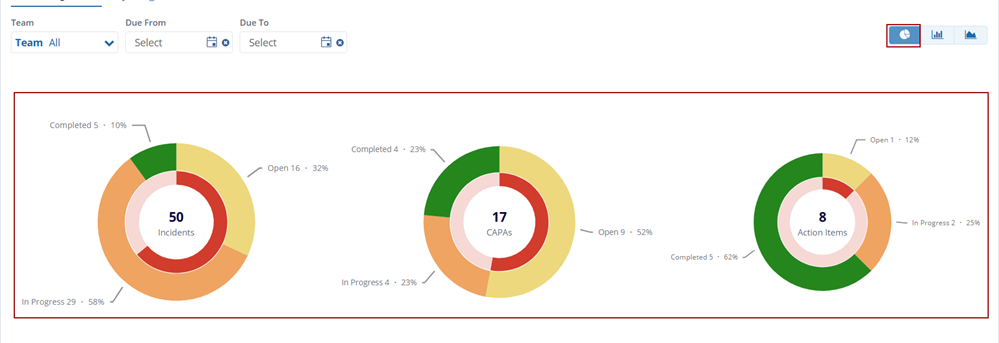
The Quality Records section also presents the records in chart format, for example:
- Donut Chart
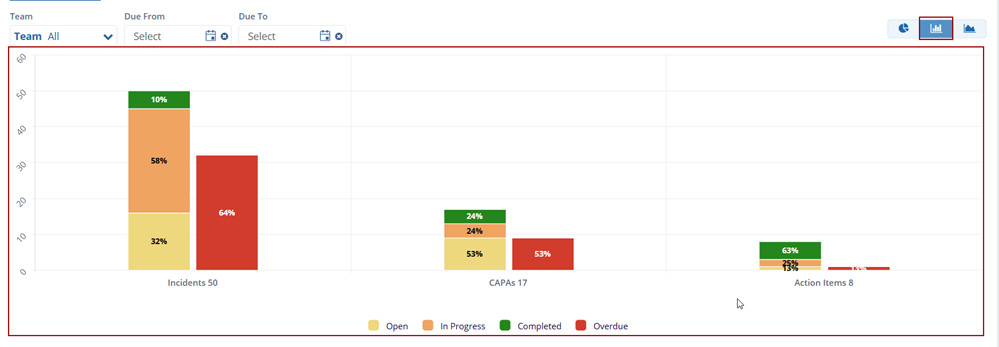
- Stacked Column Chart
- Stacked Bar Chart
Donut Chart: A Donut Chart displays data in a circular format, similar to a pie chart, with a hollow center, making it easier to compare proportions across categories.
Stacked Column Chart: A Stacked Column Chart displays data in vertical columns where values are stacked on top of each other, showing the total and the contribution of each category.
Stacked Bar Chart: A Stacked Bar Chart displays data in horizontal bars where segments are stacked to show both the total and the breakdown across categories.