Portfolio Dashlet
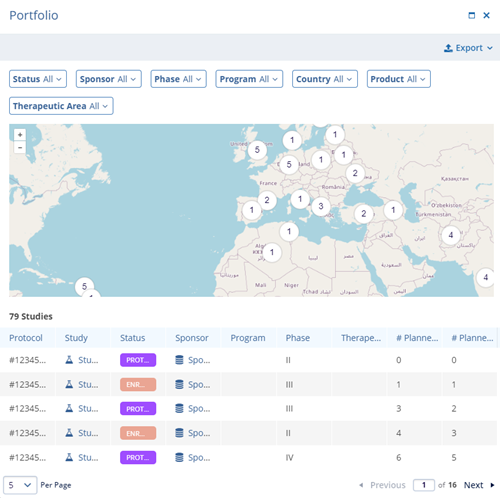
The Portfolio dashlet provides a global view of the clinical study activity. Displayed as an interactive world map, this dashlet highlights the number of studies associated with each country, offering a high-level snapshot of the geographic trial distribution.
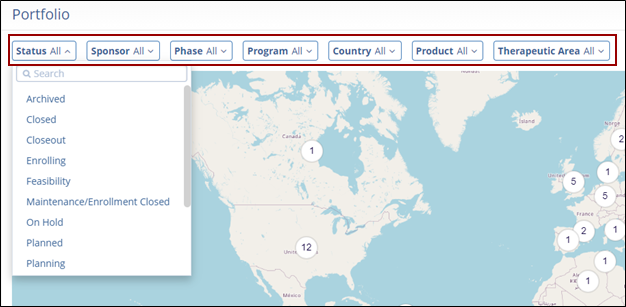
Users can tailor the map to focus on specific data by applying filters available in the dropdown menu. Filters include:
- Status
- Sponsor
- Phase
- Program
- Country
- Product
- Therapeutic Area
These filters allow users to quickly refine the view to focus on targeted aspects of the portfolio, supporting data-driven insights and strategic decision-making.
A user can perform the following actions on this dashlet:
- Click on the below-mentioned filters dropdown to customize the world map according
to the filters applied:
- Status
- Sponsor
- Phase
- Program
- Country
- Product
- Therapeutic Area
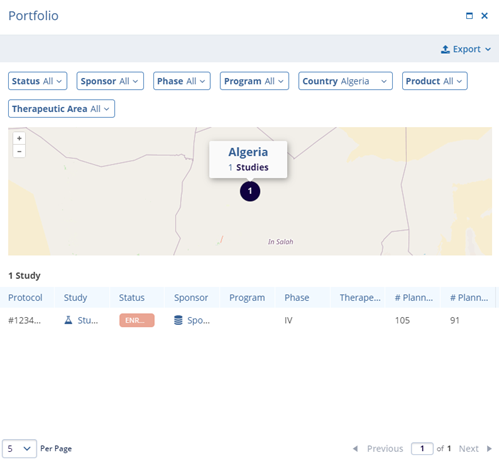
- Click on the Details button to expand the Portfolio screen and view the world map
along with the study data in a tabular format.
- On the portfolio screen, perform the following:
- Apply filters by selecting the available options from the filter’s dropdown.
- Click on Export to retrieve an export of the portfolio screen in the Grid or Chart
format.
-
Export Grid: The Export Grid option allows data to be exported in CSV or XLSX file format. Refer to the Exporting Contacts section to understand the export process in detail.
- Export Chart: The Export Chart option allows users to export the data in PDF Documents or PNG Images. Refer to the Top Countries Dashlet section to understand the process.
-
Note:- The columns and details in the Portfolio export files are different but the export process is similar to export process of the other modules.
- The process for exporting Portfolio charts is similar across all dashlets.
- Hover over the numbers on the world map with the mouse to reveal the country names
and their associated studies.
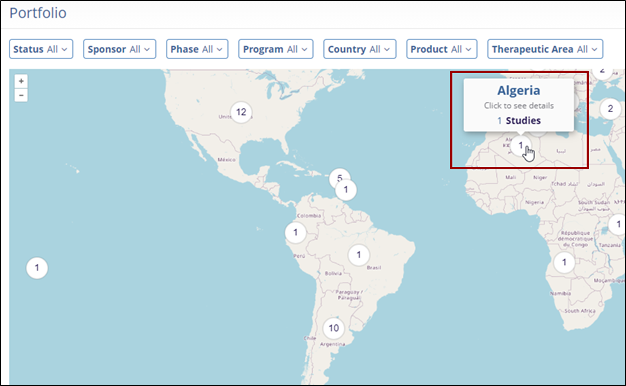
- Additionally, click on the number to get additional details associated with that particular study.
- In the Study table, click on the Up and Down arrows to sort the data in ascending and descending orders respectively.
Note: Follow the similar filtering, exporting, and sorting process listed above.